Welcome!
Forecast of Fiji Cumulative Active COVID-19↗
DISCLAIMER
Please note that I am not a physician, nor an infectious diseases expert. The information presented here is purely based on statistical analysis of the data and must not be interpreted as being medical advice, nor used as such. If you are experiencing any symptoms of illness of any kind, please consult a medical professional.
My interest in COVID stems from two influences. My PhD was in the chemical stimulation of the striatum of the brain of a live animal, and measuring the resulting dopamine in its ventral tegmental area. This experience was fascinating and reacquainted me with physiology and its chemical reactions. The second is the fact that as an analytical chemist, my interest is in measuring, and ensuring that I measure correctly. Measurement in chemistry is essentially analytical chemistry which is my focus area. Measuring accurately and reporting correctly relies on statistics, which is a tool that I use every day in my research, university teaching and other interests.
This page draws on physiology and interrelated, human health and data analysis. All views and interpretations are mine and do not reflect any associations or affiliations that I have with any organization.
Dr Shaneel Chandra
……………………………………………………………………………………………………………………………………………………………………………………………………………………..
COVID-19
If you are reading this, then it is more than likely that you are able to appreciate the gravity of the situation that the world finds itself in. There is a global outbreak of a coronavirus that has rapid mutation ability and typically high infection rate. While it may be caused by the SARS-Cov-2 virus that was responsible for previous outbreaks like SARS, this time the dynamics are rather different. The strains of this virus are rapidly mutating (see this link from the World Health Organization for more information on the variants and recently-adopted naming convention) and infections are being recorded globally. National responses vary and the results are evident for all to see. There has been a concerted effort towards achieving vaccines to contain the spread of the virus and several are in the market already. There is a chance that you may even have received at least a jab of one of these vaccines. Furthermore, the world has never had so much connectivity to data as we have now. These are some of the reasons why the COVID-19 outbreak has been getting all the attention that it has. It also means that for analytical chemists like us, there is abundant data on which we can do statistical analysis to draw out patterns.
There is a ton of real-time data on COVID-19 that is being collected, collated and posted online daily by reputable data giants. Some of these sources are the basis of the statistics being compared here, and duly acknowledged.
Different persons have different interests in COVID-19 infections. An Australian might be interested in the statistics pertaining to their homeland. A migrant in Australia may be having the same interest, plus that of their former homeland, which is the case with me. My interests in the statistics relate to Australia, which I call home, Fiji, where I was born and New Zealand, which is a related nation to ours.
On these pages, I have started to collect the statistics relating to COVID-19 in these three countries. This is both for a centralised repository as well as for recordkeeping and timeline establishment. This is by no means an exhaustive collection, and the reader is encouraged to access the databases referred to herein for more information.
Each dataset is titled with the date.
………………………………………………………………………………………………………………………………………………………………………………………………………………………………………………………………………………………………………………………..
28 August 2021
I have been keeping away from updating the COVID-19 stats analysis for Fiji here. Nothing sinister – I have been quite busy with work and travels. In addition, there has already been a lot of coverage on this page and I feel that these would suffice for now.
If anyone wishes to request a particular stat or projection, please do get in touch with me. Alternatively, I will return to this page if anything unusual or interesting pops up. There will be updates on it via my socials (Facebook and Twitter).
Thank you for being dedicated followers of this page and your feedback.
………………………………………………………………………………………………………………………………………………………………………………………………………………………………………………………………………………………………………………………..
11 August 2021

Some quick looks at the relevant stats for Fiji in Figure 110820211. The daily new confirmed COVID-19 case numbers (A) have been on a somewhat waning trend for now. Let’s hope that this is sustained. Notably, this slight attenuation in the otherwise spiraling rate happened around after the July 21 peak (data not shown here but readily available at Ourworldindata).
In Window B of Figure 110820211, the more sobering statistic of daily recorded deaths is presented. This statistic looks like it increased mid-June and has been remaining on a slightly increasing trajectory. Granted the daily fluctuations are quite high-ranging, but on an averaged basis, these are still increasing weekly.
The next statistic is Window C, which looks at the ratio of tests conducted to positive cases. This is a brutal indictment of where Fiji is currently at. The number is at its lowest. This simply means that there are minimal tests needing to be done to get a positive case identified. An examination of the data reveals that for Fiji, this stands at 4.20, meaning that there is one positive case identified among a group of five, pegging the statistic at 20% infection among the hotspots (as that is where the tests are focusing).
The last statistic is the steadily increasing number of cases recorded in Fiji to this day. Aside from all other statistics, the steady increase in this graph shows that the Delta variant is steadily spreading among Fijians as a steep rate.
Not shown but still relevant
- Fiji is currently third-highest (814.81) in the world with its daily new case numbers, behind Georgia (973.21) and Botswana (944.7).
- Fiji is third-highest (10.52) in the rate of daily deaths, after Kazakhstan (13.04) and Botswana (10.87)
- Fiji is ranked 14th in the world in its new vaccinations stats (0.99 per 100 persons). The highest is Andorra (2.28 per 100 persons).
………………………………………………………………………………………………………………………………………………………………………………………………………………………………………………………………………………………………………………………..
9 August 2021
I have previously raised the rather odd trend of Fiji’s highly oscillating (see-sawing) daily new case trends. Offline last week, a public health researcher colleague highlighted the cause of this trend. Please see Figure 090820211 for context.

It would be due to several variables that affect the samples being tested and thus translate into positive case numbers, As Dr Lisa Bricknell pointed out, the count isn’t actually a count of the number of new cases that occur each day but more a measure of the individual positive results reported.
Fiji has had a lot of challenges to its testing facilities, including:
- The sheer numbers of samples (cases) in recent times
- The availability of sufficient staff and resources at the testing lab(s)
- The rate of samples being delivered to the testing lab(s) etc.
These combine to result in a non-continuous lab processing regime. Because of the factors highlighted above, there would be days when there would be a lot more samples being analyzed (tested) and naturally, a higher chance of positive case identification. On the data websites, the statistic that would be affected by these would be the Daily New Cases figures. On those days, Fiji would report much higher numbers.
One may ask, why does this trend does not appear in the case of the United Kingdom, the United States and India, all of which are experiencing Delta variant outbreaks as well. I suggest that it has to do with the sheer factors that are against Fiji – its isolated location, small size, rather limited resources and the small number of experts on hand. This would be why Fiji has wisely sought the assistance of Australia and New Zealand to help address the shortage of skilled personnel and testing equipment, a request graciously met by both nations.

Another interesting aspect to consider is the weekend testing workload in Fiji. Naturally, with a tiring medical and public health workforce, it makes sense to rationalize the labor in the labs and reduce the testing over the weekend to help the troops get some rest. Another colleague, Dr Delma Clifton suggested matching the daily stats with the weekend dates and which I did as shown in Figure 090820212. This figure shows that generally, the day of the week did not correlate with any clear pattern in the reported daily new case numbers until July 11, 2021. After this date however, a slight increase in the reported numbers the day after the weekend started to emerge, thereby suggesting that both colleagues may be spot on (thank you, both).
It would have been great if we had some idea from the Fijian Health Ministry on whether this is indeed the case as well. It would help put these odd results into clear perspective and removed any basis for conspiracy theories to start.
While on Figure 090820212, I thought of mapping some key dates where normally, one would expect greater gatherings to occur, with daily new case numbers. Please bear in mind that these are not normal times though. The start of the Tokyo Olympics was followed by a spike in new case numbers reported three days later (on a Monday). I am terming it the Olympic Effect for now. Interestingly, there have not been any similar spikes following the dates of the rugby sevens competition in Tokyo. Rugby sevens is a sport immensely popular in Fiji and one that draws a lot of crowds watching together in a festive atmosphere. I did see some photos on the socials where persons had gathered at residences to celebrate the Fiji men’s sevens team’s successful defense of the gold medal, as well as the spirited performance of the women’s seven’s teams. (Congratulations Fiji!)
Whether there were lesser gatherings across Fiji overall than would usually occur, or people were within their designated bubbles, vaccinated, masked etc., we may not know just yet. At this stage, perhaps is more important to be thankful that no surge in case numbers have been observed since.
………………………………………………………………………………………………………………………………………………………………………………………………………………………………………………………………………………………………………………………..
4 August 2021

On current forecasts, Fiji’s total case numbers have now reached a trend of linear increases. Figure 04082101 shows the linearity of the fit. I decided to update the forecasting of this statistic based on a steady pattern of deviation of the actual cumulative case numbers from those that I had previously forecast. This systematic error in that prediction shows that the prediction needed to be updated with the changing trends in this statistics as reported by Fiji. So, I did just that, using the data from July 15 until August 3, 2021. I also would like to iterate that the linear trend replaces the previous polynomial trend being witnessed in Fiji’s case numbers. Linear trends are more gradual than polynomial, which brings optimism that the case numbers may be still increasing, but at a slower rate.
This also means a more updated prediction, which I have extended to August 31, 2021. On these trends, Fiji would have almost 50,000 total COVID-19 cases numbers by August 15, 2021.
Similarly, based on the current data, if everything remains unchanged in Fiji, by August 15, 2021, the country would be seeing about 2,693 new cases daily. I do hope this does not come to pass as just yesterday, it was reported that Fiji had received additional ANZMAT medical expertise to help it manage the current case numbers. I do hope that this team of dedicated experts are able to assist their fatigued peers in Fiji in managing the cases and bringing the numbers down.
………………………………………………………………………………………………………………………………………………………………………………………………………………………………………………………………………………………………………………………..
31 July 2021
I have not updated this page in some days now. However, the forecasting/predictions page continues to be updated daily and a lot more information is presented there as well. For those interested, it may be worth a peek.
………………………………………………………………………………………………………………………………………………………………………………………………………………………………………………………………………………………………………………………..
27 July 2021

From all accounts, it appears that Fiji is now steadily on course towards flattening its COVID-19 stats. If you have been keeping with the daily news, you may have started to piece this trend together. It becomes a lot clearer when you have been examining the forecast trends based on past data and find that the actual case numbers are following a somewhat steady downward pattern. You would recall that I have been doing just that, here.

I had a look at how the data is faring on a biweekly basis. The graph is presented to the right. April and June represent the major and somewhat minor spikes, respectively denoting that the changes in case numbers are becoming less sharp.
The second graph (left) denotes the daily new cases. Yes, the downward trend is a recent start, but it does look like a steep trajectory, and suggests no normal data fluctuation behavior. Still, while we are cautiously optimistic, as a research analyst, I have seen this movie before, so to speak. It is still worth monitoring the trend for a while longer to see if it is sustained before we start to uncork any bubblies. It is for this reason that I continue to monitor the data on my forecast page and have not shut it down.

What will happen next? Well, let’s see what has been experienced in the UK, which has largely been vaccinating its own population with the AZ vaccine (that the majority of Fijians are currently receiving). The graph to the right again shows that the major breakout of infections is usually denoted by a huge spike which represents the nation being caught off guard as it usually would not have experienced such a phenomenon before and has not prepared completely for the cases. The UK and the USA hit this situation much earlier than Fiji, and the spikes in the graph to the right shows the same.
Notably, after the first spike, correctly termed as the first wave, there are going to be subsequent second waves. The UK and the USA went through this and there is no concrete reason as to why Fiji would not either. I term these outbreak aftershocks.
Fiji may have seen its first shock, the first wave in April 2021 (as shown in the green line). It is hard to see any after shocks on the graph for Fiji in comparison to the large numbers being presented by the UK and the USA. However, if you see the top (right) graph again, you can see that June may represent the first outbreak aftershock for Fiji. There would most definitely be more, and having more people vaccinated would tend to flatten the peak considerably. Fiji is still not back to pre-April 2021 levels yet, so its current wave is by no means over just yet. So, if you are reading this and in Fiji, get vaccinated if you have not already.
………………………………………………………………………………………………………………………………………………………………………………………………………………………………………………………………………………………………………………………..
25 July 2021
Today’s reported stats dated to 24 July 2021 were listed as: 763 new cases overnight and 25,114 cumulative cases. This is comparing favorably to what I predicted last week for this period because the actual case numbers are trending lower. I hope this marks the stemming of the COVID-19 tide in Fiji. Considering that this downward trend is sustained from the last 4 days, it may renew some optimism for the future.
………………………………………………………………………………………………………………………………………………………………………………………………………………………………………………………….
22 July 2021
Over the last three days, a lot of my attention has been diverted to the prediction of daily new cases and cumulative cases in Fiji, available by clicking here. In the prediction (screen grab shown below), I have managed to estimate what numbers for each metric we can expect to see on the scenario of everything in Fiji continuing as it is for now.

No doubt, you would have seen from the screen grab that predictions based on data reported for July 22 are a bit off from the rest. In both cases, the forecast was higher than the actual case, which is quite pleasing. (In fact, I can’t recall when I have been so pleased to be proven wrong!). I just hope that this change in the pattern of data is a lasting one and not a one-off occurrence.
I also took a look at the Daily New Cases reported on Ourworldindata.org. The graph of results is presented below. You can see though that while there is a slight decline in the numbers, it is still part of the upward trend. That means that the datum for 21 June was slightly higher than expected, and it is my fear that the 22 June datum is essentially a return to the normal rising rate of daily new cases. Only time will tell, and I do not see a need to amend the forecast just yet. Yet, it is encouraging that the rate of increase since July 18 seems to have slowed down a little. We shall wait and see how the stats go for the next 2-3 days to find out.

…………………………………………………………………………………………………………………………………………………………..
19 July 2021
In July 2021, Fijians, Fiji and the world was anticipating that Fiji would be setting a world record by being the first country in the world to successfully defend a Rugby 7s Olympic gold medal.
As of today, with the latest statistics in (for July 18, 2021), Fiji is now leading the world in the new COVID-19 case numbers. Here are the latest figures (right). The figures speak for themselves.

Out of pure interest, I also compared the developments in India and Fiji with the Delta variant of the virus. To do this, I first plotted the weekly new case numbers (normalized as usual for a million population), and plotted these. It turns out that March 12 2021 was around when the Indian second wave began, so I used this as the start date. The end date is today (19 July 2021).
The death counts were slightly trickier to plot on the same set of axes and still show any trends with clarity. This is because compared to the new case numbers, the death counts were lower by about 200X. Just to facilitate the comparisons, I have presented the death counts per 100 million. Now, the trends are discernible in the graph presented bottom left.
The comparisons of this statistics are fairly clear. India’s second wave case numbers began to rise around 12 March 201 and the death count started to rise around 26 March 2021. This represents 14 days. A lot of variables no doubt contributed to the time lag between increasing case numbers, including presentation times at the medical facilities, the medical facilities own resourcing, etc. It is still noteworthy that around mid May, the mortality trends were only lagging behind the case trends by a week, and by June, they were nearly on par. That seems to indicate that with more information around the variant coming in, case management was improved, and it is also likely that external aid to boost resources on the ground was effective.

Around 18 June 2021, both trends were flattening, marking the end of the second wave in India. It must be remembered that Indian cases were affected by a shortage of vaccine supply, which was addressed through vaccine aid to supplement the output from India’s own serum laboratories making their vaccines. The third graph (below, right) shows the full vaccination stats for both nations. India achieved a significant jump in the vaccination rate around mid May from under 1% to just under 3%. Therefore, the role of increasing fully-vaccinated populations simply cannot be dissociated from the discussion.
Now look at the Fiji situation. The case numbers started to increase around 21 May 2021 and went exponential around 18 June 2021. The mortality counts also started to increase around 18 June 2021 and then went exponential around 3 July 2021. It continues on this steep trajectory to this day.

Fortunately for Fiji, its vaccination effort, despite obvious impediments continues to solider on. The health ministry and government agencies driving this tireless work amidst an imposing agenda of stubborn misinformation must be commended for this outcome.
It would be interesting to see how both trends go for Fiji. It seems that the nation is nowhere close to flattening the curve at this rate. The forecasting (based off the case numbers from June – July 2021) all indicate that the upward trend would be continuing for a while yet as according to the media reports out of Fiji, nothing significantly drastic in terms of vaccination has occurred.
I believe that there are some lessons to be learnt from the Indian experience here. It has shown us that increasing the proportion of full vaccinations may be associated with an attenuation of the new case numbers and mortality rates. We would need to examine the full set of variables associated with the pandemic to determine the full picture, but it still indicates some correlation between vaccination and outcomes in COVID-19 case management.
As I cap off, I will state that in July 2021, Fijians, Fiji and the world was anticipating that Fiji would be setting a world record by being the first country in the world to successfully defend a Rugby 7s Olympic gold medal. Instead, it has become a world example of how a global pandemic at its doorstep was invited with open arms rather than be kept out, through a coordinated system of misinformation. As a rugby tragic, my lament is “alas, if only Fiji’s 15s rugby team were this well coordinated!”
………………………………………………………………………………………………………………………………………………………………………………………………………………………………………………………………………………………………………………………..
17 July 2021

The role of varied testing rates among nations has often been overlooked in examining COVID-19 case numbers. Naturally, it would be expected that a lower testing rate would lead to a general bias on the lower side of the reported case numbers. In English, it simply means if you test fewer people for COVID-19, you would get lower positive cases (unless there were really really low case numbers that would be unaffected by lower testing rates).
Here are the cumulative active COVID-19 case numbers among nations with similar GDB to Fiji, as well as New Zealand, its close Pacific neighbor presented in the graph to the right. These numbers are usually taken as reported, which ordinarily is OK.
However, if testing rates were the same across these nations, statistically, what case numbers would we expect to see? To do that, we would have to first determine the testing rate for each nation. The graph below, to the left shows the testing rate, which unfortunately is not always reported by all nations.


I have used the testing rate for Jordan (798.96 tests per 1,000 persons) for July 13 2021. I then corrected the reported active COVID-19 cases for each nation as it would be if they all tested 798.96 persons per 1,000., as at 13 July 2021. The results obtained by this correction is presented in the graph, right. Bhutan did not report its testing rate, so the corrected rate did not compare for Bhutan.
What differences do we observe with the case numbers corrected for testing rate variations?
- With the exception of data for Jordan, all other countries’ case numbers are seen to increase when the testing rate is standardized. That is expected, as Jordan already had the highest testing rate, which is what we benchmarked against. Recall that the data for all other countries would theoretically be expected to increase due to their lower testing rates.
- We find that the order in which the case numbers stack up changes slightly. Before, the order according to decreasing case numbers was: Armenia, Jordan, Jamaica, Fiji and New Zealand. After correcting for testing rate, the order changes ever so slightly to: Armenia, Jamaica, Jordan, Fiji and New Zealand. So, aside from Jamaica and Jordan, the relative order of the countries remains unchanged.
- The clustering pattern also changes when corrected for testing rate variations. As reported, the actual case numbers have Armenia and Jordan clustered together, and towards 17 July, Fiji and Jamaica are the same. When corrected for testing rates, Armenia’s case numbers are way ahead of the pack, Jamaica and Jordan cluster together, while Fiji is lower. New Zealand consistently remains below all nations in either scenario.
- Look at the forecast case numbers, however. The increases in some cases are huge! For clarity, I present the data sets below.
| Actual data – cumulative case numbers | |||||
| Date | NZ | Armenia | Jordan | Jamaica | Fiji |
| 1-Jul | 569 | 76,005 | 73,697 | 16,942 | 5,409 |
| 2-Jul | 569 | 76,045 | 73,742 | 16,967 | 5,860 |
| 3-Jul | 571 | 76,087 | 73,763 | 16,967 | 6,290 |
| 4-Jul | 572 | 76,117 | 73,820 | 16,967 | 6,873 |
| 5-Jul | 572 | 76,135 | 73,877 | 17,017 | 7,265 |
| 6-Jul | 573 | 76,154 | 73,926 | 17,022 | 7,975 |
| 7-Jul | 573 | 76,201 | 73,990 | 17,039 | 8,857 |
| 8-Jul | 573 | 76,264 | 74,044 | 17,053 | 9,662 |
| 9-Jul | 573 | 76,314 | 74,090 | 17,077 | 10,621 |
| 10-Jul | 574 | 76,364 | 74,130 | 17,098 | 11,185 |
| 11-Jul | 574 | 76,399 | 74,185 | 17,128 | 11,726 |
| 12-Jul | 578 | 76,423 | 74,260 | 17,141 | 12,700 |
| 13-Jul | 579 | 76,469 | 74,319 | 17,153 | 13,422 |
| 14-Jul | 580 | 76,523 | 74,391 | 17,172 | 13,422 |
| 15-Jul | 581 | 76,588 | 74,456 | 17,194 | 15,490 |
| 16-Jul | 581 | 76,643 | 74,503 | 17,217 | 17,057 |
| Predicted data – Cumulative case numbers (normalized to Jordan testing rates) | |||||
| Date | NZ | Armenia | Jordan | Jamaica | Fiji |
| 1-Jul | 924 | 144,257 | 73,697 | 86,325 | 15,423 |
| 2-Jul | 924 | 144,333 | 73,742 | 86,454 | 16,707 |
| 3-Jul | 927 | 144,413 | 73,763 | 86,454 | 17,935 |
| 4-Jul | 929 | 144,470 | 73,820 | 86,454 | 19,595 |
| 5-Jul | 929 | 144,504 | 73,877 | 86,707 | 20,715 |
| 6-Jul | 931 | 144,539 | 73,926 | 86,733 | 22,738 |
| 7-Jul | 931 | 144,629 | 73,990 | 86,822 | 25,254 |
| 8-Jul | 931 | 144,748 | 74,044 | 86,893 | 27,547 |
| 9-Jul | 931 | 144,843 | 74,090 | 87,015 | 30,282 |
| 10-Jul | 932 | 144,939 | 74,130 | 87,120 | 31,891 |
| 11-Jul | 932 | 145,005 | 74,185 | 87,276 | 33,434 |
| 12-Jul | 938 | 145,050 | 74,260 | 87,340 | 36,211 |
| 13-Jul | 940 | 145,139 | 74,319 | 87,402 | 38,268 |
| 14-Jul | 941 | 145,240 | 74,391 | 87,497 | 38,268 |
| 15-Jul | 944 | 145,364 | 74,456 | 87,608 | 44,165 |
| 16-Jul | 944 | 145,468 | 74,503 | 87,729 | 48,634 |
Click here for the tabulated data of forecasts of COVID-19 active cases, updated with July 17 stats.
………………………………………………………………………………………………………………………………………………………………………………………………………………………………………………………………………………………………………………….
16 July 2021
Hello everyone. Thank you for following this page and the occasional suggestions and feedback. I do appreciate any opportunity to go back and re-check or clarify/simplify any content here.
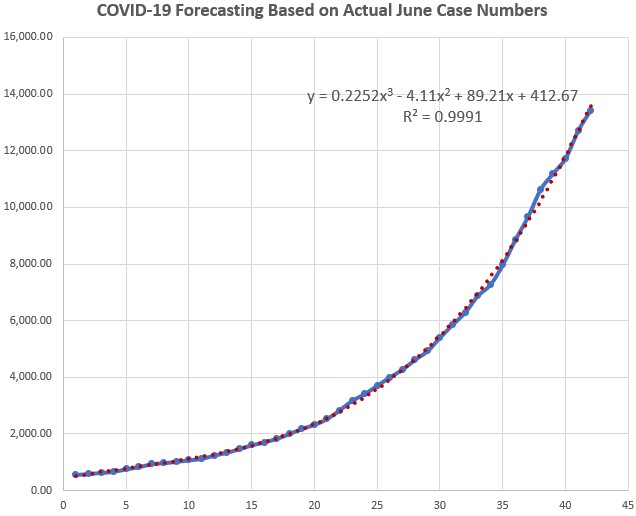
I have been able to collect and tabulate the total (cumulative) COVID-19 case numbers for the month of June for Fiji. Why June? Because this is when the data for the steep upward trend starts for Fiji. You can see (right) that the data is am almost perfect fit to a polynomial increase of the order 3.
I then worked the equation to predict the future trend in case numbers. This forecast produced some numbers that I can share as below. I have provided the weekly forecast below, on a weekly basis:
Date Forecast Cumulative COVID-19 Cases
23 July 2021 25,603
30 July 2021 37,621
6 August 53,141
13 August 72,629
Why this fit and not use the doubling rate prediction from July 15?
Well, the doubling rate estimations suggest some alarmingly-high forecasts which may seem even fanciful. For example, while I did not show the forecast data beyond 6 August 2021 yesterday, the doubling rate would suggest that by 29 August 2021, Fiji would have over 218,000 cumulative COVID-19 cases! I simply cannot believe (or maybe its hope!) that this would ever happen as the vaccination rate, slow as it may be, is still trotting along and expecting 25% of the entire Fijian population to get infected is not likely. The presence of AUSMAT teams from overseas will most definitely make an impact in terms of boosting case management on the ground.
For this reason, I feel that forecasting trends based on actual stats from June 2021 may be a more accurate projection. I may be correct or wrong – it is early days. However, this forecast can be checked for accuracy daily as opposed to 11.67 days (if we looked at doubling time-based forecasts). Being able to check the accuracy quicker is far better than waiting around. I am sure you would agree.
Click here for the raw tabulated data of forecasts.
So, back to the above forecasts: the data is there for you. I will check this data daily and use these daily checks to see if the forecasts are looking accurate. Numbers are still worrying but we hold hope that things improve in Fiji, soon.
Just a reminder folks, vaccinated persons can still get infected with COVID-19. It’s just that they may not have as severe symptoms as an unvaccinated person, or even realize that they contracted it. However, if they transmit it to an unvaccinated person, the latter will be in a world of suffering depending on their body’s health etc.
Therefore, if you are reading this, and intend to stay away from getting vaccinated by relying on others to help achieve herd immunity, I am sorry. You may be in for a shock!
………………………………………………………………………………………………………………………………………………………………………………………………………………………………………………………….
15 July 2021
Folks, I hope you are well and safe. I am just sharing a brief update today, and it specifically is around the COVID-19 case doubling time/doubling rate. I had alluded to this earlier (on June 25 to be more specific) when Fiji’s doubling time was 7.53 days. As of today, the doubling time has increased to 11.67 days, which can be approximated to 12 days. I have crunched some numbers using 25 June as the start date. On this date, there were a total of 3417 confirmed, cumulative COVID-19 cases in Fiji.
In between June 25 and July 15, the doubling time increased from 8.53 days to 11.67 days. So what I have done is forecasted the time it would take for the case numbers to double based on these doubling times.
From June 25 to July 12, the doubling time used was 8.53 days.
From July 14 onwards, the doubling time used is 11.67 days.
There is a gap between June 25 and July 15, I know. That is because for this period, I had not updated my daily data sheet with the changing doubling time. I will do so from now on.
The tabulated data looks something like this (right). The first column shows the dates which are of interest. You will note that after June 25 2021, the next date is exactly 8.53 days after, which happens to be 3 July 2021. The expected doubling of case numbers is also included in the second column under Forecasting.

Today being 15 July provides us data tagged at 14 July, when the doubling time has also increased to 11.67 days. On this trend, we can anticipate that all else being equal, the total active case numbers would be around 26,844 persons by 25 July, which is next Sunday.
The third column contains actual case numbers which can be used to compared how accurate the predictions have been between forecast and actual cases. The numbers are quite off in the earlier days (starting with June 25 data) but seem to approach similarity closer to present-day. This could be significant, or just coincidental, let us see.
The fourth column is a percentage variation between the actual and forecast case numbers. A negative sign means the actual case numbers are lower than forecast.
It is a situation with many moving parts, such as case management on the ground in Fiji, the boosting of the medical frontline workers by Australia and New Zealand, recovery rates, presentation to hospitals when afflicted with COVID etc. So I am sure that you can appreciate that forecasting is not an exact science, and this is me essentially studying the data in real time with you.
I will continue to refine the data set as we go.
………………………………………………………………………………………………………………………………………………………………………………………………………………………………………………………….
14 July 2021
In the last two days since we examined Fiji’s COVID-19 stats, little has changed that would give any room for optimism. The daily new case numbers continues on an upward trajectory, at 778 persons. Fiji remains at the third spot in this statistic globally.

The relatively stable mortality statistic associated with COVID-19 in Fiji is worth some small consolation, but as I had indicated earlier, the jury is still out on exactly how virulent the Delta strain (which is rampant in Fiji) actually is. There is some general agreement though that the conditins are milder in persons affected by the Delta variant. Yet, as the graph (below, left) indicates, Fiji is not doing too well in this regard either. Perhaps, the combined effects of an overburdened medical system, losing a fight against steady vaccination trends needed to hot herd immunity?
In a recent interview, Professor William Hanage, Associated Professor of Epidemiology at the Center for Communicable Disease Dynamics at Harvard T.H. Chan School of Public Health affirms the same. That means that for those absolutely refusing to get vaccinated, they may yet escape with mild conditions. It may yet be a different outcome for their loved ones however, who may be more prone to complications due to pre-existing conditions or sheer advanced age leaving their immune systems quite understandably compromised.

It is also pleasing to note that the medical teams on the ground in Fiji are being relieved through experts. As I write this, a second medical team would have been arriving into Fiji, a sight no doubt welcomed by their battle-fatigued peers in Fiji. Thank you, Australia and New Zealand.
It is also pleasing that Fiji is set to receive a second vaccine. This time, it is the Moderna vaccine, which is miR-based, similar to the Pfizer vaccine, and it is being provided to Fiji under the COVAX Facility from The Vaccine Alliance. (For the interested reader, I have already discussed how these vaccines work here)
Pregnant women are also on the recipient list for the Moderna vaccine, according this this government report from Fiji. This is an extremely promising outcome for multiple reasons:
- First, it spreads the vaccine ‘eggs in multiple baskets’ for Fiji. If the Australian experience is anything to go by, hesitation with the AZ vaccine based on the widely-reported (but rare) clotting incidences may just drive this group towards greater acceptance towards the Moderna alternative.
- The use of Moderna may result in several persons in Fiji getting an AZ shot followed by the Moderna. This could work out really well as evidence indicates that mixing vaccine types promotes greater vaccination efficiency in individuals. I have touched on this previously here.
The next few days may yet be of promise.
………………………………………………………………………………………………………………………………………………………………………………………………………………………………………………………….
12 July 2021
A very slight drop in the daily new COVID-19 cases for Fiji as shown below. from the 699 yesterday, a 1% decrease is notable, but not entirely encouraging at this stage. We have to wait and watch to see how this trend changes over the next few days. Fiji still remains the third-highest in the world on this statistic.

In terms of total case numbers, as at 12 July, 2021, Fiji had reported 11,726 total cases. As I write this, the echoes of stoic resistance against vaccinations, for various reasons still resonate in my mind from the weekend. A notable development was of course the blunt refusal of rugby players to support a vaccination message on their team jersey for the rugby test match against the All Blacks. I thought while the team’s outing against some of the world’s best was commendable, this development was rather unfortunate. With only 6% of the nation totally vaccinated (see right), it puts the entire, isolated country almost wholly dependent on tourism at risk.

The most dreadful outcome that I see in the vast majority of the population refusing to get vaccinated is mass casualties down the road as the vulnerable succumb to the ravages of the highly virulent Delta variant first. It is not the able-bodied persons stubbornly standing against vaccination, but rather, their elderly kinsfolk who live along them in extended families who may be lost first.
It is my hope that a country with high COVID risk does not get rendered an international pariah by the rapidly-rejuvenating tourism industry circles in the rest of the world. Who saw the packed events at Euro 2021, Wimbledon 2021, and citizens and residents of Europe and the United States freely socializing and enjoying extended holidays? Australia and New Zealand have already returned to near-normal tourism with some states within Australia through their tourism bubble. Singapore is touted as the next, and the Cook Islands are being named as well. Fiji is nowhere on this list. The potential tourists in Australia constitute 49% of Fiji’s tourism arrivals, and you can bet on it that they are not sitting by the winter fire waiting for Fiji to get its act together.
A closed border to Fiji because of its largely unvaccinated status would also likely see potential rugby careers put on hold. No vaccine = no travel.
………………………………………………………………………………………………………………………………………………………………………………………………………………………………………………………………………………………………………………………..
11 July 2021

In the last three days, the number of new COVID-19 cases in Fiji has shot up to just under 700 per day. See the figure to the right. There are no filters here, just the figures as they have been reported.
I have then examined the Confirmed Deaths statistics for four countries: Fiji, Cyprus, UK, India and Australia. I have included Australia due to the rising cases in Sydney but as the graph to the left shows, Fiji and Cyprus are still leading the pack.


I have briefly removed the Seychelles from this graph, purely to be able to show the data for these four countries, as, due to the very high death counts in the Seychelles, their data tends to dwarf that for the others. Because the stats reported on the graph are actual daily numbers, there is the usual upward and downward fluctuations leading to a saw-like trend. This is very normal for data measured at short intervals. Contrast this trend with the much-smoother appearance for 7-day rolling average of deaths to the right and you can seen what I mean. You can also see that the steep upward trend for Fiji continues.
it’s easy to see and say that Fiji has high daily case numbers, yet, its death rate from COVID-19 remains much lower than for the other countries. That is what it appears to be and there may be several causes for this, as listed below:
- The rate of infection exceeds the death rate simply because of the highly contagious Delta strain of the virus compared to its relative severity
- The death rates being reported are possibly mis-categorized (there could be COVID-related deaths but other, possibly pre-existing conditions may be listed instead
- Fiji’s vaccine rollout is achieving its goals (high vaccination rates, or not as high vaccination rates but the vaccine offers good immunity, or both)
- The other countries are having multiple strains of the virus which complicates a uniform approach towards vaccination and case treatments
Rate of infection far surpassing the death rate
As this article by the Scientific American states, the jury is still out on whether the Delta variant is more dangerous (virulent). What is agreed on, however is that this strain is definitely more easily spread (contagious).
Mis-categorized death rates
I do not have any evidence of this being done deliberately, and would rather not imply nor speculate that this is going on in Fiji. However, if someone does have any concrete information of its existence, please email me. The issue has been raised in several discussions, including The Economist and the Center for Disease Control and Prevention. One way to estimate COVID-deaths is to compare the deaths before and after COVID, e.g. in 2019 and 2021, and then accounting for the population change, estimate the excess deaths and attributing these to COVID. To be able to estimate the excess deaths however, the country would need to have accurate data available for both before and after periods.
Immunity starting in the community
Make no mistakes, the AstraZeneca vaccine is from a reliable manufacturer and has been widely administered in many large and Western jurisdictions, including Australia and the vaccine’s country of origin, the UK. That Fijians are getting vaccinated with it would suggest that they are getting some of the best vaccines in the world. As a respected peer in the scientific community has suggested last week, perhaps one of the reasons why The Seychelles have such high numbers of cases and deaths despite equally high vaccination rates is their reliance on another vaccine. This article from the ABC makes some good points.

Multiple strains in the community
This data is hard to get. Most countries do not report this. See for yourself on the right. I have selected seven countries, but only have data available for three of those. If ourworldindata couldn’t get it, there is little chance I can, but I will keep trying.
What we can see from the data that is available though, the UK has the most of a singular (Delta) strain of the virus while India had the least. A significant proportion (14%) was classified as ‘Others’. This would no doubt factor into planning the best approaches to vaccinate, treat and manage cases,
………………………………………………………………………………………………………………………………………………………………………………………………………………………………………………………………………………………………………………………..
As I write this today, Fiji sits fourth on the Daily New Confirmed Cases list, with 561.26. The highest is still Seychelles with 1,053.2. Not a ladder to be wanting to climb any time soon. With this development, now it is another unfortunate group which Fiji is getting benchmarked against. The usual worrying statistics like the case fatality rate (CFR) now stand out for these four nations as listed below:

Fiji: 0.53%
Mongolia: 0.49%
Cyprus: 0.47%
Mongolia: 0.43%
The one constant hope in all this would be the proportion of fully vaccinated individuals in Fiji. However, in this stat as well, Fiji is placed abysmally at the bottom of the pile amidst the above group and the UK and the USA. This means that the nation (Fiji) is grossly ill-prepared to even contain the effects of a full-blown delta variant infection tsunami. The following graph on full vaccination numbers speaks for itself. It is inevitable that once the virus has spread out of management stages, it will be rampant and infection rates will spiral.

Based on what we have observed in the Indian scenario, once the infections increase, the deciding factors between a system brought to its knees and another which can cope is the availability of skilled personnel to help treat and manage severe cases and the resources that they need. We already have been told that there are limited resources (e.g. only 40 ventilators at the Colonial War Memorial Hospital which is the closest facility equipped to handle such cases. That leaves the other ally in the war, which is the frontline staff (doctors and nurses). Once this resource is compromised (and it is looking more and more grim), then it’s all hell breaking loose. Where is the containment? Is it time to escalate vaccination access by using 24/7 mass vaccination hubs?
Here is another worrying stat where Fiji has taken lead in the world – that of Daily New Confirmed Deaths.

On this number, accounting for population variations, Fiji has 3.35, the USA has 0.94 while the UK has 0.49. The other three nations (which are in the top four with Fiji with the highest case numbers are not even in these figures. That indicates that while they may be having the highest numbers of new cases with Fiji, these three countries (the Seychelles, Mongolia and Cyprus) are managing their cases far better than Fiji. Moreover, as the graph to the right shows, Fiji has almost matched the UK in the highest stat of COVID-19 deaths overall!
The other core issue to consider is, when will Fiji get over half its population fully vaccinated? I have addressed this question below in a lot of depth, and hopefully it is sufficient motivation for those who are still vaccine-hesitant to reconsider their stance.
On my July 1 2021 post, I had covered the vaccination regime for the UK, the USA and Fiji. I will elaborate a little more here on this. According to records on ourworldindata.org, Fiji’s vaccination began in March 2021 with full vaccinations by May 2021. Fiji used a mix of India’s Covishield (click here for more information on this vaccine) and the AstraZeneca vaccines, both of which rely on the use of adenoviruses (click here for more information on adenovirus).
How the AstraZeneca Vaccine works to protect humans against coronaviruses
As a chemist, I thought that I should reach to my vocation and discuss how the AZ vaccine works. Click on the link above to access this.
……………………………………………….
When will Fiji get most of its population fully vaccinated by?
Research indicates that against the coronavirus, the adenovirus requires two administrations, around 3 months apart. Then, it takes the body 2 weeks to fully get its immune system up to 100% effectiveness against viruses (applies to both AZ and Pfizer). So if you are in Fiji, where the Covishield/AZ vaccination began around 16 March 2021, you should, at the earliest have received your second (booster shot) around 16 June 2021 and possibly have achieved full immunity against the coronavirus around 1-2 July 2021. It means that the earliest lot to be vaccinated in Fiji only achieved full immunity only last week.
Until then, or, if you have not had two weeks following the administering of your booster shot, consider yourself at risk, mask up, avoid large groups, stay within your bubble and follow health advice.
………………………………………………………………………………………………………………………………………………………………………….
Folks, I have been away for a few days. Here are the latest stats on the daily new confirmed cases of COVID-19 worldwide. Fiji is ranked 8th highest in the world. See the following graphed information showing the same. (As always, all data is represented on a population based on 1 million)

In fact, the list being so short, can be presented in its entirety, below:

This is a fairly tragic situation to be in. The cumulative, confirmed list of cases (meaning all the confirmed cases in Fiji as of 5 July 2021), also stood at 6872.71 persons (see below).

The above graph may indicate that Fiji is holding on quite well (since March 1, 2021). However, compare the above graph with that below. The following graph shows the confirmed deaths on a 7-day rolling average (meaning the number of deaths over the last 7 days). The upward climb in Fiji’s numbers are telling a rather different story to the cumulative data. That confirms that things have started to turn very bad for Fiji in the last few days.

If you scroll below, you would find that on 25 June 2021, with 3117 cases in Fiji, I had extrapolated the data at the time and predicted that by 2 July, we would have doubled the 3117 case numbers. Well, to its credit, since then, Fiji managed to bring its case doubling up (which is good for the doubling time) from 7.83 days to 8.99 days. In between, the doubling time was almost steady at 8.53 days, which we can approximate as the new doubling time for the period. (For now, we can ignore the latest doubling time of 8.99 days)
That means that numbers would then have predictably changed as shown below:
Previous scenario
Cases on 25 June 2021: 3117
Doubling time: 7.83 days
New doubling date from 25 June 2021: 25 June 2021 + 7.83 days = 3 July 2021
Expected total by 3 July 2021: 2 × 3117 cases: 6234 cases
New (present) scenario
Cases on 5 July 2021: 3117
Doubling time: 8.53 days
New doubling date from 25 June 2021: 25 June 2021 + 8.53 days = 3 July 2021
Expected total by 3 July 2021: 2 × 3117 cases: 6234 cases
Daily rate of increase: 3117 new cases ÷ 8.53 days = 365.41 new cases per day
So for 4 July, the expected total COVID-19 case numbers ought to be: 6234 cases + 365 cases = 6599 cases.
As Fiji has 6872 cases instead, this represents an unaccounted number of 6872-6599 = 272 cases. The sums don’t add up – interesting. The doubling rate could not have increased because that is based on the reported data, and Ourworldindata calculates that. So, somewhere along the way, has there been a shortfall in the actual number of cases being reported in Fiji?
Let us wait and see what tomorrow brings.
……………………………………………………………………………………………………………………………………………………………………………………………………………………..
The daily confirmed new cases statistic as at 1 July 2021 for Fiji was at 305. This is still upward but on an oscillatory (fluctuating – up and down) trend, which is expected for daily new cases. The 7-day average statistic would be much smoother, for reasons that I have already explained earlier (scroll down this page to access it). The UK stats are also upward, despite its high vaccinations, which is quite interesting as well.

I also had a look at the mortality rate for the four countries that I have been comparing these past few days: the UK, the USA, Fiji and India. There are some interesting trends as shown in the graph below.

The United Kingdom
Two plateaus are evident, one in August 2020, and the second around February 2021. The March – May 2020 period corresponded to a rising trend in deaths. This is most likely due to spring (people still keeping indoors, thus increasing transmission), early days of medical knowledge around virus transmission, treatment of those with pre-existing conditions getting afflicted with the virus etc. A plateau around June 2020 could be due to greater knowledge and better case management, assisted by a gradual return to warmer conditions which also tend to be kinder to human health, especially the elderly.
Then, around November 2020, the mortality started to rise again, and the most likely cause is what we now know as the Alpha variant. It took a while for this strain to be diagnosed (not surprising as there are still a lot of moving parts to this virus).
To better understand the trend, we need to also start to look at another set of data, this time of vaccinations. In the UK, the Oxford/AZ vaccine had started to be rolled out. See the vaccination data below. The UK vaccination began around January 2021 (the data starts from around this period as well). Unfortunately, the AZ vaccine is spaced 3 months between doses and full vaccination is achieved only after two weeks following the second dose. Vaccinating millions of persons is no easy feat (just ask Australia), so there would have been a 14-week delay from the first vaccinations for full immunity to set in. On a timescale, that corresponds to around mid-April at the earliest. Yes, there would have been some immunity from first doses as well, and it could have been beneficial for some. If you see the close up of the vaccination graph later, it shows that by April 2021, the mortality rate was quite well flattened.


The United States
Similar considerations apply to the US cases. Around February 2020 was a period of the start of mortality cases, although the increase was rather sedate in the US compared to the UK. Mortality started to spike around the end of November in the US though and started to plateau around the first week of March. Remember that the US have been vaccinating their population with predominantly the shorter-spaced Pfizer vaccine, which has only three weeks of spacing between doses, and thus achieves full immunity after 5 weeks following the first vaccination. Pfizer rollout began around mid-December. Five weeks following this would mean that around the end of January, 2021, people would have started to reach full immunization protection. A gradual flattening of the mortality trend suggests this may have been a key protective feature against more deaths.
Fiji
Fiji’s is a relatively recent set of trends. Full vaccination was reached around May 2021, using the Indian Covishield (TM) and the (pharmacologically-similar) AZ vaccines. Unfortunately, by then, the Delta variant was already in Fiji. Strong social fabric meant enforcing restrictions against gatherings was a lost cause (a claim still being held by health authorities in Fiji). As a result, the virus was well and truly rampant before the population was able to be fully vaccinated.
I cautiously propose that we are seeing today in Fiji is vaccination playing catchup. Unfortunately, this is a race where the vaccine is not the hare – the highly-transmissible virus is. For this reason, it is absolutely critical that the vaccination drive goes either 24/7, or steps up a notch while keeping the virus transmission at bay. Fiji may need to consider restricting movement (irrespective how ineffective the Fijian authorities may hypothesize it would be) and go all out in pushing the vaccination.
The next disturbing trend that I had predicted was the overwhelming of the medical facilities in Fiji once COVID-infection severity starts to ramp up.
It seems to have begun.
……………………………………………………………………………………………………………………………………………………………………………………………………………………..
29 June 2021
The data today looks rather the same as that for the previous few days. Fiji’s doubling rate is at 8.00 days. It is downward – what a relief! But! Not out of the woods yet, Fiji. See the daily new case figures below as well. Fiji is at 268.

Vaccination makes a huge difference to COVID-19 contraction, as well as transmissibility. It also minimizes the infection. It will keep you out of hospitalizatiom.
Get vaccinated if you have not done so already.
Here are some interesting findings on vaccine dose combinations. Essentially, the current medical advice is to get your first, followed by a second dose of your vaccine, both being of the same type of course.
Well, today, some new findings have been released that show greater vaccine efficacy if the vaccines are combined. This article captures the essence of the work and their key points are reproduced below:
- AZ followed by Pfizer induced higher antibodies and T cell responses than Pfizer followed by AZ
- Both of these mixes induced higher antibodies than two doses of AZ
- The highest antibody response was seen after two doses of Pfizer, and the highest T cell response from AZ followed by Pfizer
It obviously is not grounds (just yet) for insisting vaccine mixing of course. However, I would say with reasonable confidence that subject to certain conditions being realized, vaccine mixing (I call it vaccine hybridization) will start. I suggest the following conditions may need to be in place:
· Nations with the purchasing power to secure multiple vaccines
· The above nations would aim to have reached around 80% full vaccination
· The science accompanying vaccine hybridization would be evolving in real-time (findings continuing to be publicized as studies are being done). Hence, the scientific knowledge would feature quite prominently in the detailed logistics.
· There would be specific vaccines that would be ‘mixed’, e.g. AZ and Johnson & Johnson are similar in their pharmacology and biochemistry, as are Pfizer and Moderna. Hence, only dissimilar vaccines would be candidates for mixing, e.g.
o Pfizer + AZ
o Pfizer + J&J
o Moderna + AZ
o Moderna + J&J
Let us see.
……………………………………………………………………………………………………………………………………………………………………………………………………………………..
28 June 2021
I have not updated this page since 26 June and had hoped that the two-day spacer would give us some more clarity in any new direction the statistics may be taking. Unfortunately, with regards to the daily new cases, not as much, with Fiji getting 292 new cases at 28 June 2021.

As for the doubling rate, it has increased ever so marginally, from 7.53 days to 8.04 days. See below.

Now, even with 8.04 days, it would suggest that Fiji has improved its doubling rate by increasing it. Perhaps it does, however a 6.77% statistic is not something to be celebrating just yet. If we see the second lowest doubling rate (meaning the second worst rate than Fiji’s), it is from St. Kitts and Nevis. What is important to note though is that the second-lowest statistic is still 2.5X better than Fiji’s!
I like to say to my students that “a picture is worth a thousand words and a graph is worth a million”. Graphs present numerical data with consummate ease. For that reason, I graphed the data in the above table for the countries with a doubling rate less than 50 and present it below.

You can probably guess what I am hinting at here. In the graph, Fiji’s stats cut a lone and forlorn figure, meaning the doubling rate is well below the rest of the countries, which also tend to cluster together around the 20s-40s. Fiji is the only nation with a doubling rate in single digits!
………………………………………………………………………………………………………………………………………………………………………….
Are we seeing some slight shoots of a turnaround with today’s statistic (239 from yesterday’s 333)? See the downward trend? It is too early to tell, but one can hope.

As at 26 June, 2021, Fiji has crept up two spots on the Daily New Confirmed Cases to now sit at 21st-highest in the world.
On paper, the doubling rate remains at 7.83. With a total of 3416 confirmed cumulative cases as at today, I will keep monitoring the trends and see if the doubling rate changes.
I see a lot of people accessing this site, mainly from Fiji, New Zealand, Australia, France, China and the US. Thank you for following these thoughts, and all suggestions and feedback are very welcome.
………………………………………………………………………………………………………………………………………………………………………….
Yesterday’s statistics showed that Fiji had the 23rd-highest rate of daily new confirmed COVID-19 cases globally. Today, I have included another equally sobering statistic: the doubling time of total confirmed cases. As the name suggests, this is a measure of how much time it takes for confirmed case totals to double to the preceding level. Though I did not include this figure yesterday (bad news is best delivered in stages sometimes), I can confirm that it was at 8.53 days. This means that based on yesterday’s total confirmed 2843 cases, after 8.53 days, this number would be expected to double to 5686 cases. Essentially, on a crude rounding off, this represents a doubling rate per week.
Now, these are hard figures on what the future case numbers in Fiji are likely to look at. Even more terrifying is the fact that Fiji has the shortest doubling rate in the whole world!
I am sure that the critical thinkers would be asking, what is the statistic on the other end of the spectrum (i.e. what is the longest doubling rate being noted for elsewhere?). The short answer is (for Albania): 30,683 days (equivalent to 84 years) and with such a large figure, it is virtually stretching into infinity. This means, the case management in Albania is almost perfect.
Here is the table of data from the ever-dependent ourworldindata.org. Both data from June 23-24 are presented.

And here is the same data as above, but from June 24, 2021.

Within 24 hours, the doubling rate went from 8.53 to 7.83 days! So doubling within a week.
The graph below shows the total confirmed cases versus the doubling rate. This is some very useful data which reveals further detail, such as the absolute numbers the countries are dealing with.

I have touched on Fiji’s stats in relation to the data in the graph. On the other hand, let us look at Paraguay’s statistics. With 57,709 cases, not only does Paraguay have about 20 times higher COVID-19 case numbers than Fiji, it also has a doubling time of 153 days (~5 months). Essentially, much greater numbers with a strong case management (for now). This is a sobering comparison. Fiji has a battle with high numbers and an ever-worsening doubling rate.
I daresay that looking at the statistics, it would not be fearmongering or exaggerating at all now to start to consider Fiji as India 2.0.
Perhaps, it may be time to question the merits of the thought process behind the Fiji Government rejecting the notion of a lockdown/curfew. Granted there may be a “track record of poor public compliance”, or no guarantee that there would be compliance with a directive.
Would you still not even give it a try?
3117 cases, 7.83 days to double case numbers! The problem with this statistic is the high case numbers in Fiji and at the current projections, that’s just under 100,000 cases before end of July at the present doubling rate! (And that too, is coming down rapidly, mind you).
So, out of curiosity, I went old school, picked up my calculator (OK, that’s metaphorical for Excel), and worked backwards to see for myself just how the doubling rate for Fiji has changed and determined this through the following steps:
- Tallied today’s case numbers (let’s call it x)
- Divided today’s case numbers by 2 (let’s call it y) and identified the date which had case numbers closest to y.
- Repeated the above steps until I reached a stable value for y.
Based on the above, I determined the following historical doubling rate trend,

Fiji seems to have dropped its doubling rate from a high 24 days to just 7.83, but the clincher came between April and mid-May. From then on, it was basically downhill, a trend that continues today.
Let’s see what tomorrow brings.
………………………………………………………………………………………………………………………………………………………………………….
24 June 2021
By the time you are reading this, you would be well aware that Fiji’s daily new case numbers have hiked to 200 and 311 cases on 23 June and 24 June, respectively. What has happened to cause such a massive jump? Here are the stats.

I am not on the ground in Fiji, so will not speculate nor hypothesize. However, based on media reports in Fiji, there seem to be certain types of behavior which, on the face of it cannot be completely ruled out as contributing to these high numbers. Some of these include:
*Wanton disregard of isolation rules in various zones
*Vaccine hesitancy
Now over the last 4 days, I have been data mining and trying to produce trends that are associated with the daily new case numbers. These were locked behind a password-protected link, but now that the horse has bolted, I can share some. The following table shows the predicted case numbers from a linear fit of the case numbers data. As you can see, based on these, the worst we would have expected on June 23 would have been 210 cases, but that was surpassed by 69 cases more to bring it to 279. Similarly, today would have seen a maximum of 223 cases, not the 311 that was reported. Why are there such variations?
| Date | Linear forecast | ||
| 23-Jun | 210 | ||
| 24-Jun | 223 | ||
| 25-Jun | 236 | ||
| 26-Jun | 249 | ||
| 27-Jun | 262 | ||
| 28-Jun | 274 | ||
| 29-Jun | 287 | ||
| 30-Jun | 300 | ||
| 1-Jul | 313 |
The prediction has been dependent on whether Fiji does nothing new to change its case management and minimization of the spread of the virus (that is not the case, as you would know that Australia and New Zealand have sent in technical experts to help contain the spread). So we expected some changes to the predicted numbers below, certainly after a few days (when the oversea teams gave identified and implemented ways to address the situation).
On the reasonable assumption that Fijian medical authorities would have have done as much as possible to bring daily new case numbers down, to see the opposite happen suggests that there are counterforces to the authorities’ efforts. I do not have the information on the whole range of these forces, but the two causes earlier highlighted certainly seem to be involved.
Would these be enough to open eyes, one can wonder.
We can just hope that there are no further steep rises, but based on what we saw in India (where the Delta variant originated), it is likely that the situation would quite likely get severe. The trigger would be when hospital presentations (COVID-19 patients coming to hospitals for treatment) overwhelm the resources. At the last count, there were only 40 respirators!
Also, in what I can only hope is an unrelated, development, Fiji has stopped reporting its tests per case statistic. The last was on June 14, which I reported here (at 54 tests per case).

………………………………………………………………………………………………………………………………………………………………………….
23 June 2021
If you have been following the global trends in COVID-19 cases, you would have observed those in the UK to have slowly been creeping up with Fiji’s numbers, and yesterday, almost surpassing Fiji. This is the third wave being reported in the UK. Here are the stats, and we have been seeing the UK numbers creep upward for just over a month now .

At the time of writing this (23 June 2021), the proportion of people fully vaccinated in the UK stood at about 46.4%. Compared to the same metric in Fiji (2.01%), the UK is at least 23X ahead of Fiji. What went wrong?
The third wave is being pushed by the dreaded and highly infectious Delta variant. Fiji has the same variant at the moment spreading infection. The UK has a combination of four vaccines approved for use, Pfizer, Moderna, Oxford University/AstraZeneca and Janssen. It is difficult to identify at this stage the proportion of each vaccine administered and what the efficacy rates of these in the population overall may be.
In Fiji, there is only one vaccine being administered – Oxford/AstraZeneca (AZ). The efficacy of this vaccine is reported by the WHO to be 63.09%. However, recently, against the Delta variant, the AZ and Pfizer efficacy have been reported to be 92% and 96%, respectively. This means that against the Delta variant at least, the AZ and Pfizer vaccine efficacy are somewhat similar.
What does this mean for Fiji? Well two things come to mind. The first is obviously the low vaccination rate despite a vigorous Government campaign to encourage vaccine uptake. The second is that Fiji is still in the thrall of winter (irrespective of how mild a tropical winter tends to be). This means that the Fiji is squarely set for a higher impact of the virus spreading into the community that the UK – certainly until September 2021. People tend to remain indoors with poorer ventilation more than they would in the summer which is why winters tend to be notorious for viral outbreaks, according to this Nature article.
……………………………………………………………………………………………………………………………………………………………………………………………………………………..
22 June 2021
Today’s focus is just on the 7-day average of new cases, simply because there have not been significant changes in the other reported stats. The graph below shows the latest data.

Unfortunately, it is the same grim outlook for now, Fiji. The number of cases may seem like a slight leveling amidst the steep increase in the last week or so. It is too early to make conclusive calls on whether this is going towards the much-recognized plateau before it starts to decline. If you happen to be in Fiji, there is little else that you can do, except, follow the medical advice and rules designed to contain the spread of COVID-19.
On a positive note, it is also good to see the real-time dashboard which informs everyone on the designated zones and stats in each zone. Click here for to access the dashboard. well done authorities and GIS professionals for designing this interface.
As someone who has been very fortunate to have traveled to many parts of the world, I can attest to Fiji’s relatively cheap mobile internet costs and high data penetration. This is why, I am very optimistic that the dashboard and real-time data access will help inform what is otherwise an already very well-informed population.
Unfortunately, just as a little knowledge is dangerous, we are now observing the double-edged sword of the Information Age that we find ourselves in. I have already addressed what I would (without restraint) term as the somewhat nonsensical interpretation of abundant knowledge around COVID-19 and vaccines.
Yet, it may be time to underscore it by calling out those who choose to misinform by the selective and warped interpretation of information. It is evident that those peddling misguided opinions around Science generally display a very superficial level of knowledge as it is, without venturing into specialized pronouncements that involve microwave radiation, the pharmacology and biochemical effects of vaccines, viral chemical structures etc.
Let’s leave medical pronouncements to the experts, folks.
Restricted link – Data Modeling and Projections (please contact Shaneel for access)
……………………………………………………………………………………………………………………………………………………………………………………………………………………..
20 June 2021
In the two days since our last glance on Fiji’s stats, there have been some movements. Here is the trend on daily new COVID-19 cases in Fiji. Unfortunately, over the last two days, this trend has shot up somewhat from 100 to 128 to 167. This is the highest this statistic has ever gone for Fiji, and it has now also started to exceed that of the UK.

Should we be alarmed – yes! The unfolding evidence presented by these figures strongly suggest that the control of management of this outbreak may have been wrestled out of FIjian medical authorities’ hands. Naturally, the sensible thing to do is to seek help from other jurisdictions with demonstrated experience and resources in COVID-19 management. This is why Fiji very aptly sought the assistance of Australia and Australia responded swiftly and positively. See this (SBS) article on Australia’s aid coming to Fiji at this juncture (in addition to vaccines).
However, it remains to be seen exactly how the other facet of COVID-19 management will proceed from here on in Fiji. I am of course, referring to the role of the public at large in observing the announced restrictions, following the medical advice and ensuring a personal level of self-care (masking, sanitizing etc.). A boost in the medical resources is essentially a stop-gap measure, and the long-term sustainability of Fiji’s medical response will continue to depend on efforts from within – that of its population.
It is disturbing to see social media posts of outright denials of an outbreak of COVID-19, a misplaced distrust in the vaccine and a rather oversold expectation that herbal and non-medical means are solely going to stand up to the onslaught of a rapidly mutating viral strain of a biochemical type that naturally makes it very infectious. I mean, if COVID-19 was a conspiracy, then perhaps we are observing a never-anticipated unity worldwide in perpetuating it, are we not? Prior to January 2020, there was global unrest in certain areas and between known actors. If these actors have suddenly all jumped onto this ‘conspiracy’, I’d like to meet the person who managed to get them all to agree, and hand them the next half-decade’s Nobel Peace Prize! Wouldn’t you?
Secondly, what is with the “5G chip in the syringe”? Despite the advances in nanotechnology which has been progressing quite rapidly, and even with Moore’s Law (number of transistors per computer chip would be doubling every year), I am quite unconvinced that 5G-emamanting chips can be mass produced at such small dimensions just yet. As someone who developed a microwave-based chemical vapor depositor in their own PhD, I can tell you that you would need at least a magnetron to generate microwaves and the technology to make such magnetrons so small, then embed them into syringe orifices would render the cost of the syringe to several hundreds of dollars at the very least. The cost of a syringe to administer the vaccine is under US$6, so who would be subsidizing the difference? And why? Any microwave device producing any radiation needs a power source to be able to do so, so what would be powering the so-called chip in the syringe? As a chemist, I can confirm to you that the First Law of Thermodynamics tells us that that energy cannot be created or destroyed, just transferred. This means you can’t get more energy out of less, and in a syringe? Well….you get my drift.
Should we panic – no! But I think we are close to some firm actions needing to be taken in Fiji soon.
The rest of the stats (CFR, cases per case) have either not been recently updated/not changed much in the last few days so I have not included them here, today.
What I did look up, however were the vaccination stats. The vaccination status is a number that is going to be critical to forward planning the next few strategies. The more the number of fully-vaccinated persons, the greater the resilience of the population (within the specified period of achieving immunity of course, which is 14 days after the second dose has been administered). Thus, it is good to know where each nation that we are looking at here stand. Here are the stats.

The statistics speak for themselves. I have taken the liberty to include the full information (statistics and metrics being measured) in the above. Fiji has an admirable stat, overall. However, it is not out of the woods just yet. Certainly not until full vaccination has been reached. It does not state it on the graph above but as at 20 June 2021, Fiji had a full vaccinated stat of 0.51%. Not a world leader in any way, but I am sure it is a dedicated effort to reach that position on the ground.
I will cap off today’s post with this relevant article from The Courier Mail (20 June 2021). Some hard-hitting facts are in there.

……………………………………………………………………………………………………………………………………………………………………………………………………………………..
18 June 2021
Here are the daily new case statistics for 18 June (meaning this is the date that I accessed these stats, which were the latest available figures at the time.
Here are the 7-day rolling average stats. Still upward.

The daily new case stats are looking as below. It is early days yet, although there seems to have been a slight decline in these figures compared to yesterday. Promising. Keep heeding the advice, folks, minimize unnecessary travel, mask up and avoid groups.

I have not presented any new graphical data on the tests per case (still at 54 from yesterday). This is something worth waiting to observe over the longer term.
The Case Fatality Rate (CFR) though is presented below. I can share that on 11 May 2021, Fiji’s 1.97% CFR exceeded that of India (1.09%), so see a gradual flipping of this stat between both nations is extremely encouraging for Fiji. I would suggest that (at face value), the medical treatment regime for COVID-19 cases either seem to be working, or, the cases did not have other comorbidity issues that have been leading to high mortality rates elsewhere. No, I am not a Negative Ned, but just a very skeptical science researcher (we’re all of the discerning bend by default). Still, I will give full credit to the Fijian Government for doing their utmost to prevent the transmission, contain the spread and mitigate the effects.

Not sure if I will get a chance to post in the weekend but I will try my best. Have a safe weekend!
……………………………………………………………………………………………………………………………………………………………………………………………………………………..
17 June 2021
Folks, today’s stats are presenting a worse scenario than what we saw yesterday. I present the first graph below, which is the Daily New Cases (7-day rolling average). This means that the numbers represent the new cases being reported each day. Of course, because these cases go up and down, instead of each actual count, the total new cases for the last 7 days are divided by 7 days, which is what the 7-day rolling average means.

A quick comparison between the same data yesterday would show that there is an increase noted for today (please ignore the scale on the graph which still states 16 June). Remember that the stats represent a rolling average and yet today, we see this figure has gone over 80.
Now as an average, that means for yesterday,
72 cases average x 7-day period = 504 cases existing for the period June 9 – June 16
With today’s cases
89.72 cases average x 7-day period = 628 cases existing for the period June 10 – June 17
Between both days, the difference is 628 cases – 504 cases = 124 cases. The difference of 124 cases those that have been diagnosed over 24 hours.
We can actually tabulate these figures, but Ourworldindata.org have kindly done it for us, as shown below:

You can see in the graph above that Fiji’s stats hover just over 125. This indicates that our calculations are reasonably accurate. You may ask, why am I not definitive and exact in my calculation? Well, it’s because yesterday, I got the graphed data but did not check the tabulated exact numbers, so the the figure of 72 that I have used in the calculation above is what I estimated from the graph, hence the variation.
The astute reader would have spotted something straightaway and that is the inclusion of India in the above graph. Why? Because Australian and New Zealand figures are no longer comparable to those being seen in Fiji. A new comparator emerges and it is India. However, while India has started to bring the daily actual new case numbers down from mid May, Fiji’s numbers are still increasing from around the same period (unrelated development I am sure).
Here is the testing stat around each positive case, graphed.

Also included are the actual numbers as at 17 June 2021 (inset in the above graph). As I explained in yesterday’s pictorials, it simple means that:
Australia tests 6115 persons before it identifies 1 positive case,
New Zealand tests 1013 persons before it identifies a positive case
Fiji tests 54 persons and a positive case pops up. It is still better than that in India (22 tests per positive case), but that is an incredible indictment of how far COVID-19 infections have spread into the community in Fiji.
……………………………………………………………………………………………………………………………………………………………………………………………………………………..
16 June 2021
The COVID-19 outbreak currently experienced in Fiji is effectively what is termed as the nation’s second wave. My sincere apologies for the rather poor quality of the graphics in this first posting. I will improve these in later editions.
Here are some trends that I picked off today.


There are several metrics around COVID-19:
- The number of daily new cases (how quickly the infection is spreading)
- The extent of cases prevailing (the rate of recovery, though this is fairly standard)
- Mortality (how many of those who contracted the infection died as a result)
The last is of particular interest in the Fijian context. The case fatality rate as it is known is where Fiji has not had very good management in, until recently. When COVID-infections are admitted into hospitals, there have to be adequate resources to serve their needs, including beds, medication, even routine services like linen, meals etc. Then, the ever-critical oxygen, which in the Indian experience can often spell the difference between case management and blowouts.
Based on the data, Fiji’s case fatality rate is on the decline, but see the ever-increasing incidences of daily new cases. That is where the danger is still lurking. If this new case trend is not flattened or reduced, Fiji stands at high risk of a India 2.0. Considering that essentially, it is the subdivisional and divisional (Lautoka, CWM and Labasa) hospitals that are the best resourced for managing complex cases like COVID-19 infections, and these themselves are on either restricted services, or have had to be closed off (Lautoka), it may not take too much more to overwhelm these facilities.
The dark COVID clouds over Fiji promise a storm-like fury of cases, if advice like masking up, restricting unnecessary travel and other precautions are ignored.
It’s in the people’s hands now.
Comments on the content here, or a request for specific data analysis are welcome. Please contact us by clicking here.